
Restaurant Executive Compensation: Bonus Structures in Public, Private Equity, and Portfolio Companies

Executive bonus programs are where strategy, governance and human capital intersect. For restaurant companies, where margins are thin, consumer demand volatile, and labor/supply costs dynamic, incentive design must balance short-term operational control with long-term value creation. Below is a comparison of how public companies, private equity, and PE portfolio (port-co) restaurant firms’ structure executive bonuses, why they differ, what metrics they use, and practical templates you can adapt.
Whatever it is, the way you tell your story online can make all the difference.
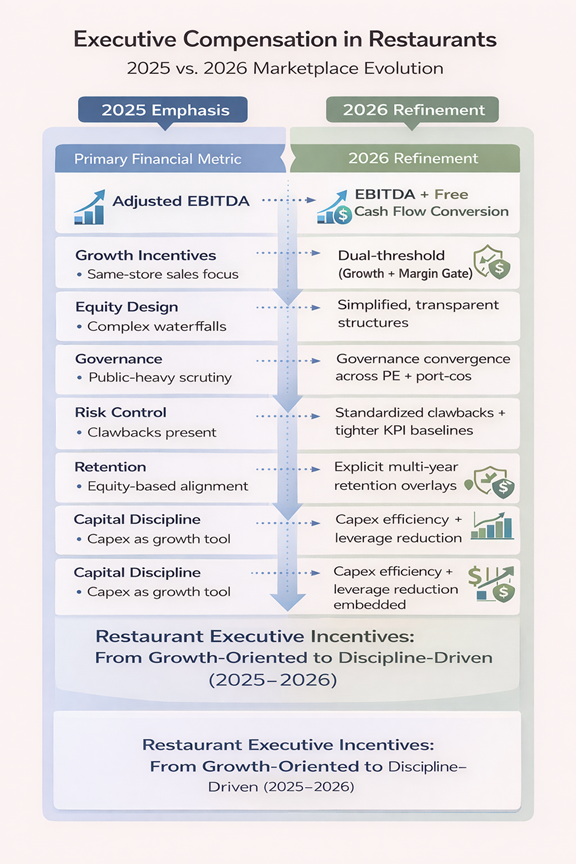
2026 Market Update: How Restaurant Executive Incentives Are Evolving
Restaurant executive compensation has become more disciplined since this article was first published in September 2025. While the ownership model still drives incentive structure, boards and private equity sponsors are placing greater emphasis on cash flow quality, margin protection, and leadership stability.
Several trends are shaping how restaurant executive bonus plans are designed in 2026:
• greater emphasis on free cash flow conversion rather than EBITDA alone
• stronger margin protection mechanisms
• simplified private equity equity waterfalls
• increased governance scrutiny in portfolio companies
• explicit incentives tied to leadership retention
The underlying architecture of executive compensation has not changed. Public companies still emphasize disclosure and long-term shareholder returns. Private equity firms still focus on exit valuation. Portfolio companies continue to balance retention with alignment.
What has changed is calibration. Incentive structures are becoming more disciplined, more transparent, and more closely tied to liquidity and operational durability.
Big picture: why ownership model shapes incentive design
Ownership drives horizon, risk tolerance, disclosure requirements, and governance. Public companies operate with broad investor scrutiny, proxy advisors and SEC disclosure rules; their incentives emphasize measurable annual performance plus long-term stock-based metrics. PE sponsors focus on a finite investment horizon and a clear exit valuation target; compensation leans heavily into equity upside and cash bonuses tied to milestones that enhance enterprise value. Port-cos often blend short-term cash bonuses with equity instruments (LLC units, rollover equity, carry-like structures) engineered to maximize alignment toward the eventual exit. These differences manifest in target levels, metric mixes, vesting, and claw back provisions.
Public restaurant companies: structure, metrics, and governance
Typical design: A public restaurant C-suite package is built of base salary, an annual cash bonus (short-term incentive / STI) and long-term incentives (LTIs: restricted stock units, performance share units, stock options). Annual bonuses are usually expressed as a percentage of base (target %), with a payout range (0%–200%+ of target depending on plan). LTIs are tied to multi-year performance (often 3 years) and relative or absolute stock metrics.
Common metrics: Adjusted EBITDA (or Adjusted EBITDAR), same-store sales (comps), operating margin, cash flow/Free Cash Flow, unit growth or unit economics (AUVs, restaurant-level margins). For CEO pay, TSR (total shareholder return) or relative TSR is frequently included in LTIs. Boards often combine financial (70–80%) and strategic/individual goals (20–30%) in annual plans. Public filings and compensation reports show this shift toward multi-factor STI mixes.
Governance & disclosure: Compensation committees must document goals, formulate, and rationale in proxy statements; changes in macro performance (e.g., a rough year for the sector) can compress payout curves or alter target settings. In recent years some public restaurant CEO median pay fell in response to industry headwinds and boards used plan design levers and disclosure to explain outcomes.
Practical template (public CEO):
Base salary: market-competitive (paid in cash).
Target annual cash bonus: 80–150% of base (actuals 0–200%+).
STI metrics: Adjusted EBITDA (40–50%), Same-Store Sales (20–25%), Operating Cash Flow or margin (15–20%), Strategic/individual goals (10–15%).
LTI: 50–150% of base in RSUs/PSUs with 3-year performance cycles; TSR or EPS growth often used.
Governance: Committee approval, disclosure in proxy, claw backs and anti-hedging policy.

Private equity owners — emphasis on value creation and exit mechanics
PE rationale: PE returns derive from improving operating performance and multiple expansion then exiting; incentives are structured to maximize value at exit. PE firms compress the time horizon (typical fund investment window 3–7 years) and therefore favor instruments that scale management upside upon successful exit.
Common instruments: LLC membership units, carried interest-like structures, rollovers, and performance-vested equity that pays at liquidity. Cash bonuses (annual or transactional) remain important to retain talent, but equity upside typically eclipses cash over the hold period. Vesting schedules can be longer (often four years or more) and carry-like economics or waterfall structures align payouts with fund returns. Surveys show many PE-backed management grants follow multi-year vesting and complex payout waterfalls.
Performance linkage: Payout often depends on achieving multiple layers: EBITDA targets, margin improvements, capex or unit economics milestones, and final exit valuation thresholds. Some plans include “hurdles” (minimum IRR or multiple of invested capital) below which equity pays little or nothing.
Practical template (PE portfolio CEO):
Base salary: slightly below equivalent public peers (cash conserved for return).
Annual cash bonus: 30–100% of base, often tied to EBITDA improvement, unit economics, and KPI milestones (customer acquisition costs, AUV lift).
Equity/LLC units: meaningful (often 1–10% of management pool, depending on level and size), with 3–5 year vesting (sometimes performance-contingent).
Transaction bonus: “Deal bonus” payable at exit, scaled to proceeds above predetermined hurdles.
Protections: Change-of-control, market-based severance; claw backs if management causes value loss.
Key nuance: PE firms will tailor the equity instrument (phantom units, actual equity, rollover equity) to tax and governance preferences while ensuring alignment with fund economics.
Portfolio-company (port-co) implementation — the operational bridge
Port-cos are where the rubber meets the road. PE sponsors usually implement standardized frameworks but must adapt to the operating realities of restaurant brands (multi-unit dynamics, franchise models, franchisee economics, supply chain seasonality).
Design considerations unique to restaurants:
Unit economics focus: Restaurant economics are often unit-level; bonuses tied to system AUV, unit margin, and franchisee health (for franchisors) are common.
Labor & food cost volatility: Short-term incentives should not reward top-line growth that erodes margins; bonuses must incorporate margin or cost-control gates.
Scalability milestones: For growth strategies, incentives tie to unit openings, successful market entries, or development agreements.
Retention vs. alignment: Because PE relies on existing management expertise during the hold period, retention awards are commonplace (time-vested and performance-vested).
Practical template (port-co COO/Head of Ops):
Base salary: competitive to maintain retention.
Annual bonus: 50–100% of base with metrics like restaurant-level EBITDA margin improvement (40–60%), labor efficiency (20–30%), and development milestones (10–20%).
Equity: smaller individual allocations than CEO, but participation in management equity pool; vesting often tied to both time and EBITDA/exit triggers.
Measurement, calibration and common addenda
Whether public or PE, robust incentive plans share several components:
Baseline measurement: Establishing clear, auditable baselines for all KPIs is essential. Without clean baselines, adjustments for one-time items, accounting changes, or extraordinary events will be contested.
Payout curves and leverage: Linear vs. tiered payout curves matter. Public companies often publish maximum payout caps; PE plans may intentionally backload or use tiered waterfalls to increase upside sensitivity to high performance.
Claw backs and malus: Increasingly common in both public and PE contexts to address misconduct or restatements. Public firms have regulatory pressure; PE sponsors include contractual claw backs to protect fund economics.
Governance mechanics: In public companies, compensation committees and external compensation consultants set targets and disclose them. In PE port-cos, the sponsor or Operating Partner typically leads design, but an independent compensation committee or advisor is still good governance.
Example KPI mixes by ownership & role
Public CEO (target bonus 100% of base):
Adjusted EBITDA: 45%
Same-Store Sales / AUV: 25%
Free Cash Flow / Cash Conversion: 15%
Strategic/ESG/Leadership goals: 15%
PE CEO (target cash bonus 60% of base + equity):
Adjusted EBITDA improvement: 40% (absolute and % uplift)
Margin expansion (restaurant level): 30%
Development/rollout milestones: 15%
Retention & leadership metrics: 15%
Equity: meaningful carried upside tied to exit hurdles
Port-Co Head of Ops (target bonus 60–100%):
Restaurant-level EBITDA margin: 50%
Labor cost per cover / hours per sale: 25%
Unit economics / development KPIs: 25%
These are starting points; each firm must calibrate targets to baseline performance, market comparables, and the time horizon.
Why Restaurant Executive Compensation Matters for Leadership Hiring
Executive compensation design also shapes how restaurant companies recruit senior leadership. Experienced restaurant executives evaluate compensation packages carefully because bonus metrics signal board priorities, ownership expectations, and operational strategy.
Private equity backed restaurant platforms often attract operators who are motivated by equity upside tied to value creation. Public companies attract leaders comfortable operating within governance frameworks and investor scrutiny. Franchise brands frequently structure incentives around system growth and franchisee economics.
Understanding these structures helps restaurant boards and investors recruit the right leadership profile for the ownership model.
Pitfalls and how to avoid them
Misaligned metrics: Rewarding top line without margin gates leads to growth that destroys value. Fix: hybrid metrics combining revenue and margin/cash flow.
Unclear baselines: Ambiguity invites dispute. Fix: specify adjustments for accounting changes, acquisitions, or macro shocks.
Overly complex waterfalls: Complexity reduces transparency and can demotivate. Fix: prefer clear payout curves with an illustrative worked example.
Short horizon incentives for long problems: For structural improvements (unit economics, culture), short annual bonuses may not capture real progress. Fix: layer LTIs and multi-year performance units.
Poor governance in port-cos: Sponsor-driven programs without independent oversight can breed mistrust. Fix: include independent advisors or an independent committee to review target setting and payouts.
Implementation checklist (practical steps)
Define investment horizon and ownership objectives.
Create clean KPI definitions and baseline data; document adjustment rules.
Select metric mix that balances short-term controls and long-term value.
Choose instruments (cash vs. equity) appropriate to retention and alignment goals.
Model payout outcomes across scenarios (base, stretch, downside).
Draft contractual provisions: vesting, acceleration, claw backs, change-of-control, severance.
Obtain governance sign-off: board/comp committee (public) or sponsor OS/committee (PE).
Communicate clearly to executives: scope, timing, and rationale.
Monitor and iterate annually, using empirical payout results to recalibrate.
Design with ownership intent
An effective executive bonus program is not an administrative checkbox. It’s a strategic lever shaped by ownership model. Public companies need transparency, defensible targets and investor communication. PE and port-cos need alignment to exit economics, retention through a transition, and ability to drive unit economics improvements quickly. The best programs are elegant: few, high-impact metrics; clear baselines and gates; predictable payout mechanics; and equity structures that make leadership owners of the outcome.